A visual understanding of research
 | ||||
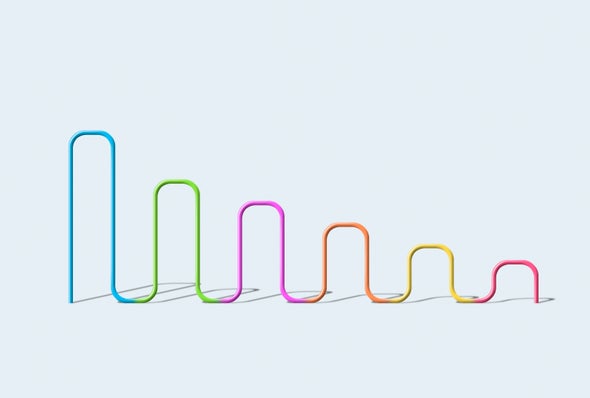
| Charts and graphs to help visualize data | ||||
| Recommended Reading: | ||||
| ||||
| ||||
| ||||
| ||||
| ||||
|
.gif)


| Want more science news? Click here to subscribe to Scientific American. |
| Download the Scientific American App | |||
|


|


Comments
Post a Comment